2011-12 Departmental Performance Report - Annexes
Table of Contents
- Annex A – Health Related R&D Expenditures as a Percentage of the Gross Domestic Product (GDP)
- Annex B – Number of Medical Sciences Publications per Million of Gross Domestic Expenditure on Research and Development (GERD) dollars of G7 Countries
- Annex C – Number of Papers in Medical Research Published by Canadian Investigators, 2000 to 2011
- Annex D – Average of Relative Citations (ARC) in Health Research
- Annex E – Average Relative Impact Factor (ARIF) in Health Research, 2011
- Annex F – Growth of Researchers and R&D Personnel of G7 countries
- Annex G – Number of Health Researchers and Trainees Supported by CIHR
- Annex H – Diversity of Investigators Funded by CIHR
- Annex I – Publications and Knowledge Translation Activities from CIHR Funded Research
- Annex J – Grants and Awards under Program Activity 1.1
- Annex K – PhD Graduates in Canada
- Annex L – Diversity of Researchers and Trainees Funded
- Annex M – Grants and Awards under Program Activity 1.3
- Annex N – Partner Contributions
- Annex O – Grants and Awards under Program Activity 1.4
- Annex P – Diversity of Knowledge Translation Programs (Sub-Program Activity 1.4.2)
Annex A – Health Related R&D Expenditures as a Percentage of the Gross Domestic Product (GDP)
Compared to G7 countries, Canada consistently ranks in the Top 3 of 7 reporting G7 countries based on 2008, which is the most recent year for which Canadian data were available.1
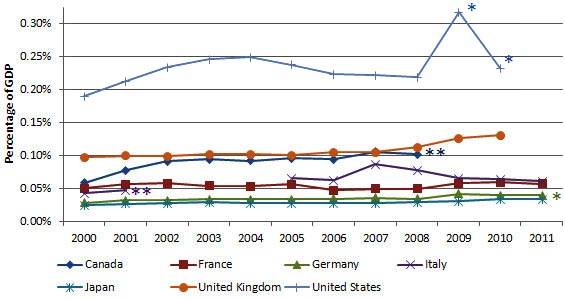
Notes: *Provisional data; **data unavailable
Annex B – Number of Medical Sciences Publications per Million of Gross Domestic Expenditure on Research and Development (GERD) dollars of G7 Countries
The number of Canadian publications in Medical Sciences per million dollars of Gross Domestic Expenditure on Research and Development (GERD) has increased steadily over the past 10 years. In 2009, which is the last completed year, Canada was ranked second overall.2
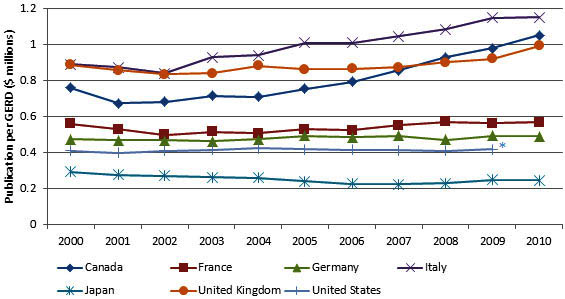
Notes: All data were provisional for 2010; *Data unavailable
Annex C – Number of Papers in Medical Research Published by Canadian Investigators, 2000 to 2011
Canada increased the number of papers in Medical Research over the past 10 years while its world share of medical publications has remained stable at nearly 5% from 2009 to 2011.3
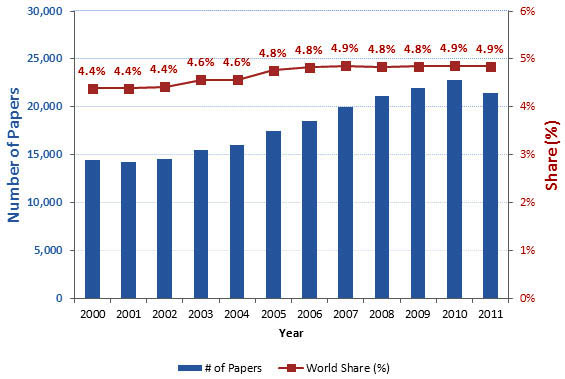
Note: Data from 2011 are provisional due to the nature of the data: some papers published in 2011 (bibliographic year) will only be counted in 2012.
Annex D – Average of Relative Citations (ARC) in Health Research
An internationally recognized, standardized measure for citations used to determine the impact and quality of Canada's published health results is the Average of Relative Citations (ARC). The more a published work is cited, the higher the quality of work and value to the health research community. The ARC score is calculated for every country in a particular field (in this case, medical research) and then normalized to 1.0. An ARC value above 1.0 for a country means that, on average, the country's publications in that field are cited more often than the world average.
The ARC value for Canadian publications in medical research is 1.40 in 2011 with Canada ranking 2nd place in the G7 countries which is the same ranking as 2010 and 13th place worldwide (data not shown).4
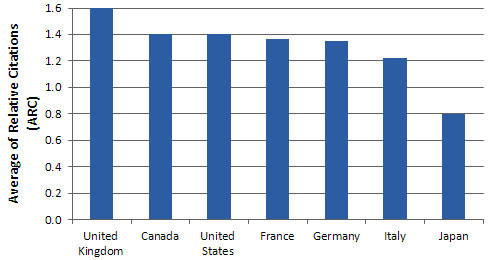
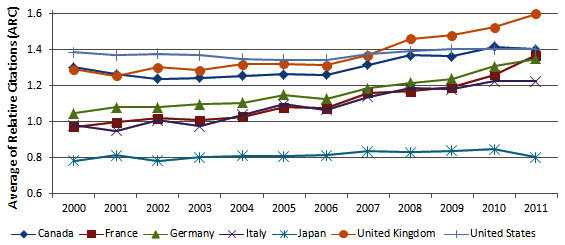
Note: Data from 2011 are provisional due to the nature of the data: ARC value for publications is based on the number of citations received by a paper in a 3-year period following its publication.
Annex E – Average Relative Impact Factor (ARIF) in Health Research, 2011
The Average of Relative Impact Factor (ARIF) is a measure of the scientific impact of the journals in which a paper is published. The prestige (relative impact) of the journals in which papers are published is a reflection of the quality and value of the papers represented in those journals. The ARIF score is calculated for every country and then normalized to 1.0 for the world average. An ARIF value above 1.0 for a country means that, on average, the scientific impact of the journal in which papers are published for that country, is higher than the world average.
The ARIF for Canada was 1.22 in 2011 with Canada ranking 3rd place in the G7 countries which is the same ranking as 2010 and 8th place worldwide (data not shown).5
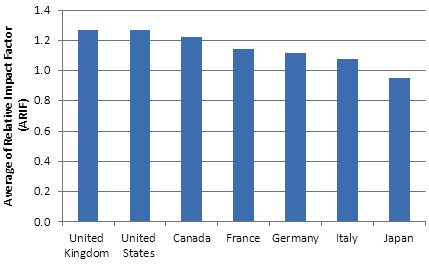

Note: Data from 2011 are provisional due to the nature of the data: ARIF value for publications is based on relative impact of the journals in which papers are published but the number of papers in 2011 is not completely finalized.
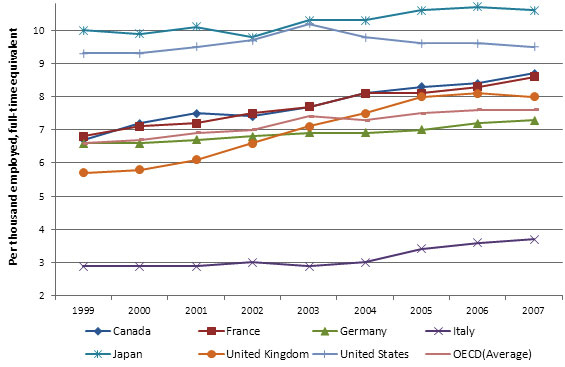
Annex F – Growth of Researchers and R&D Personnel of G7 countries
Canada steadily increased the number of researchers per capita and was ranked 3rd among the G7 countries in 2007.6
Notes:
- Researchers are defined as professionals engaged in the conception and creation of new knowledge, products, processes, methods and systems.
- 2007 represents the last year with complete data for G7.
- OECD data include member countries Australia, Austria, Belgium, Canada, Chile, Czech Republic, Denmark, Estonia, Finland, France, Germany, Greece, Hungary, Iceland, Ireland, Italy, Japan, Korea, Luxembourg, Mexico, Netherlands, New Zealand, Norway, Poland, Portugal, Slovak Republic, Slovenia, Spain, Sweden, Switzerland, Turkey, United Kingdom, United States, along with non-member countries China, the Russian Federation and South Africa.
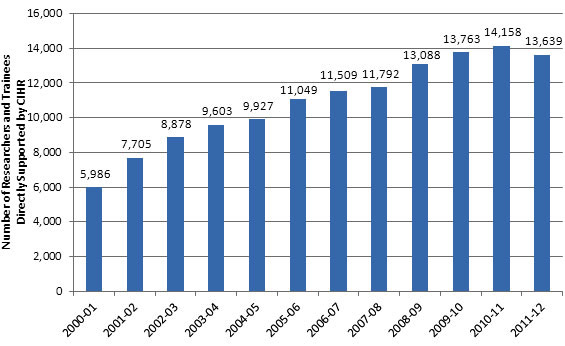
Annex G – Number of Health Researchers and Trainees Supported by CIHR
Since CIHR's inception, the number of CIHR-supported health researchers and trainees has grown from approximately 6,000 in 2000-01 to over 13,000 in 2011-12.7
Notes:
- Includes a distinct count of the number of active personal identification number of researchers and trainees with a role as nominated principal investigator, principal investigator, or co-investigator on a grant or award that received a payment from CIHR in 2011-12.
- This count does not include trainees and support staff indirectly supported by grants and awards funding.
Annex H – Diversity of Investigators Funded by CIHR
In 2011-12, CIHR continued to fund all areas of health research by primary Institutes and themes.8
| Primary Institute | Number of Funded Applications | CIHR Expenditures (in Thousands) |
||
|---|---|---|---|---|
| 2010-2011 | 2011-2012 | 2010-2011 | 2011-2012 | |
Notes:
|
||||
| Aboriginal Peoples' Health | 136 | 106 | $12,706 | $8,661 |
| Aging | 487 | 436 | $31,753 | $30,917 |
| Cancer Research | 1,056 | 969 | $83,836 | $84,867 |
| Circulatory and Respiratory Health | 876 | 802 | $84,778 | $81,956 |
| Gender and Health | 250 | 229 | $17,441 | $19,052 |
| Genetics | 774 | 725 | $82,110 | $82,764 |
| Health Services and Policy Research | 605 | 594 | $37,967 | $40,142 |
| Human Development, Child and Youth Health | 608 | 604 | $53,914 | $55,143 |
| Infection and Immunity | 1,066 | 958 | $106,462 | $97,609 |
| Musculoskeletal Health and Arthritis | 531 | 515 | $42,061 | $40,925 |
| Neurosciences, Mental Health and Addiction | 1,406 | 1,282 | $118,858 | $112,344 |
| Nutrition, Metabolism and Diabetes | 553 | 539 | $49,998 | $50,073 |
| Population and Public Health | 563 | 533 | $47,100 | $47,656 |
| Primary Institute Not Specified | 1,678 | 1,457 | $197,845 | $198,620 |
| Grand Total | 10,589 | 9,749 | $966,829 | $950,730 |
| Primary Theme | Number of Funded Applications | CIHR Expenditures (in Thousands) |
||
| 2010-2011 | 2011-2012 | 2010-2011 | 2011-2012 | |
| Biomedical | 5,324 | 4,881 | $474,942 | $458,008 |
| Clinical | 1,327 | 1,289 | $129,421 | $129,998 |
| Health systems/services | 704 | 727 | $57,642 | $57,304 |
| Social/Cultural/Environmental/Population Health | 1,103 | 1,038 | $91,406 | $90,847 |
| Primary Theme Not Specified | 2,131 | 1,814 | $213,417 | $214,573 |
| Grand Total | 10,589 | 9,749 | $966,829 | $950,730 |
Annex I – Publications and Knowledge Translation Activities from CIHR Funded Research
CIHR recently received data from Research Reporting System (RRS), which is an end-of-grant reporting module collecting information from CIHR-funded researchers on the results of their grant(s). The initial launch of the RRS has focused solely on the CIHR's Open Operating Grant Program (OOGP). The data collected between April 1st, 2009 and March 31, 2012 has shown 9,302 Knowledge Translation activities.9
| Total | Average/grant | Max | Min | |
|---|---|---|---|---|
Notes:
|
||||
| i. Publications | ||||
| Articles published1 | 2,858 | 9.9 | 85 | 1 |
| ii. Knowledge Translation activities | ||||
| Presentations2 | 5,005 | 17.3 | 191 | 1 |
| Interviews3 | 1,439 | 5.0 | 299 | 1 |
Annex J – Grants and Awards under Program Activity 1.1
In 2011-12, CIHR increased spending to $459.7 million and supported 3,946 grants in the Open Research Grant Program.10
| Sub-Program Activity | Number of Funded Grants/Awards | Total CIHR Expenditures | Average Value | |||
|---|---|---|---|---|---|---|
| 2010-2011 | 2011-2012 | 2010-2011 | 2011-2012 | 2010-2011 | 2011-2012 | |
| Open Research Grant Program | 4,047 | 3,946 | $457,994,700 | $459,737,966 | $113,169 | $116,507 |
Annex K – PhD Graduates in Canada
Highly educated people are trained to conduct research and be a vital resource for innovation. With the breadth of knowledge and skills learned in their training years, PhD graduates are well positioned to significantly contribute to Canada's economy and society. As part of CIHR's efforts to train and sustain Canada's health research community, CIHR offers a wide variety of programs to support PhD students and Postdoctoral trainees.
According to a recent OECD study on the number of PhD graduates from select G7 countries, from 2005-2009, Canada consistently produced the fewest PhD graduates per 100,000 population aged 25-29 when compared to France, Germany, Italy, Japan, the UK and the US. Canada consistently ranked 6th or 7th over that period; however, the number of PhD graduates has increased by 21% over that period from 191 graduates in 2005 to 232 graduates in 2009 per 100,000 population aged 25-29. This rate of growth is higher than any of the other countries in the survey that reported data over that time period. 11
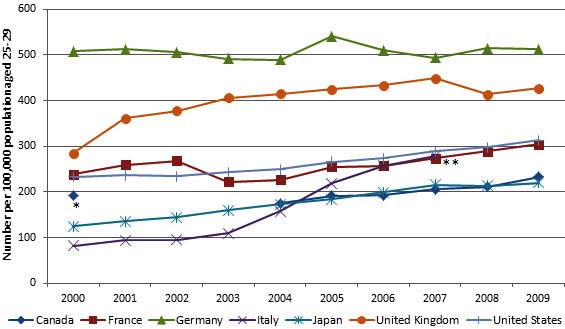
Notes: *Data unavailable from 2001 to 2003 for Canada; **data unavailable after 2007 for Italy
Annex L – Diversity of Researchers and Trainees Funded
Number of Researchers and Trainees Directly Supported by CIHR under Program Activity 1.212
| Primary Institute | Number of Researchers and Trainees by Primary Institute 2010-112 |
Number of Researchers and Trainees by Primary Institute 2011-122 |
|---|---|---|
Notes:
|
||
| Aboriginal Peoples' Health | 26 | 21 |
| Aging | 175 | 159 |
| Cancer Research | 417 | 331 |
| Circulatory and Respiratory Health | 218 | 151 |
| Gender and Health | 62 | 55 |
| Genetics | 238 | 163 |
| Health Services and Policy Research | 183 | 150 |
| Human Development, Child and Youth Health | 209 | 157 |
| Infection and Immunity | 290 | 236 |
| Musculoskeletal Health and Arthritis | 111 | 88 |
| Neurosciences, Mental Health and Addiction | 509 | 384 |
| Nutrition, Metabolism and Diabetes | 157 | 123 |
| Population and Public Health | 222 | 179 |
| Primary Institute Not Specified | 686 | 660 |
| Total | 3,503 | 2,857 |
| Primary Theme | Number of Researchers and Trainees by Primary Theme 2010-112 |
Number of Researchers and Trainees by Primary Theme 2011-122 |
| Biomedical | 1619 | 1228 |
| Clinical | 533 | 421 |
| Health systems/services | 263 | 219 |
| Social/Cultural/Environmental/Population Health | 368 | 313 |
| Primary Theme not specified | 711 | 674 |
| Total | 3,494 | 2,855 |
Annex M – Grants and Awards under Program Activity 1.3
In 2011-12, CIHR increased or maintained direct investments under program activity 1.3.13
| Sub-Program Activity | Number of Funded Grants/Awards | Total CIHR Expenditures | Average Value | |||
|---|---|---|---|---|---|---|
| 2010-11 | 2011-12 | 2010-11 | 2011-12 | 2010-11 | 2011-12 | |
| Research Commercialization Program | 182 | 181 | $13,958,524 | $16,751,392 | $76,695 | $92,549 |
| Network Centres of Excellence Program | 16 | 18 | $38,597,000 | $38,577,000 | $2,412,313 | $2,143,167 |
Annex N – Partner Contributions
In 2011-12, total external partner contributions increased to $123.8 million from $118.7 million.14
| Partner | Partner Contributions 2010-11 |
Partner Contributions 2011-12 |
|---|---|---|
Notes:
|
||
| External Partner - Leveraged Contributions Total Leveraged Partner contributions (includes the voluntary sector, private sector, and provincial health research funders) |
$78,903,282 | $89,693,263 |
| External Partner – Tri-Council Programming Partner contributions for Tri-Council Programming (Networks of Centres of Excellence, Business-Led Networks of Centres of Excellence, the NCE New Initiative Program, and Centres of Excellence for Commercialization and Research) |
$39,844,367 | $34,112,660 |
| Total External Partner Contributions | $118,747,649 | $123,805,923 |
Annex O – Grants and Awards under Program Activity 1.4
In 2011-12, CIHR invested a total of $255.9 million under program activity 1.4.15
| Sub-Program Activity | Number of Funded Grants/Awards | Total CIHR Expenditures | Average Value | |||
|---|---|---|---|---|---|---|
| 2010-11 | 2011-12 | 2010-11 | 2011-12 | 2010-11 | 2011-12 | |
| Institute Strategic Initiatives | 2,585 | 2,260 | $238,880,833 | $228,186,647 | $92,410 | $100,968 |
| Knowledge Translation Programs | 662 | 671 | $24,841,164 | $27,756,136 | $37,524 | $41,365 |
Annex P – Diversity of Knowledge Translation Programs (Sub-Program Activity 1.4.2)
In 2011-12, CIHR continued to fund knowledge translation in all of the primary Institutes and themes.16
| Primary Institute | Number of Funded Grants and Awards 2010-11 |
CIHR Expenditures 2010-11 |
Number of Funded Grants and Awards 2011-12 |
CIHR Expenditures 2011-12 |
|---|---|---|---|---|
Notes:
|
||||
| Aboriginal Peoples' Health | 6 | $120,556 | 7 | $264,779 |
| Aging | 17 | $614,901 | 23 | $642,210 |
| Cancer Research | 33 | $873,288 | 36 | $839,980 |
| Circulatory and Respiratory Health | 34 | $1,410,744 | 28 | $1,139,827 |
| Gender and Health | 18 | $717,216 | 16 | $311,959 |
| Genetics | 22 | $555,525 | 19 | $559,982 |
| Health Services and Policy Research | 90 | $5,786,435 | 141 | $8,871,969 |
| Human Development, Child and Youth Health | 31 | $1,546,058 | 41 | $1,762,968 |
| Infection and Immunity | 32 | $1,012,614 | 29 | $1,017,107 |
| Musculoskeletal Health and Arthritis | 19 | $659,202 | 19 | $473,808 |
| Neurosciences, Mental Health and Addiction | 53 | $1,435,615 | 49 | $1,774,008 |
| Nutrition, Metabolism and Diabetes | 22 | $742,252 | 21 | $860,181 |
| Population and Public Health | 34 | $1,966,682 | 39 | $2,265,280 |
| Primary Institute Not Specified | 251 | $7,400,077 | 203 | $6,972,078 |
| Total | 662 | $24,841,164 | 671 | $27,756,136 |
| Primary Theme | Number of Funded Grants and Awards 2010-11 |
CIHR Expenditures 2010-11 |
Number of Funded Grants and Awards 2011-12 |
CIHR Expenditures 2011-12 |
| Biomedical | 160 | $4,964,592 | 139 | $4,125,522 |
| Clinical | 56 | $2,449,260 | 69 | $2,480,859 |
| Health systems/services | 101 | $6,578,255 | 148 | $9,679,161 |
| Social/Cultural/Environmental/Population Health | 84 | $3,120,565 | 98 | $4,165,974 |
| Primary Theme Not Specified | 261 | $7,728,492 | 217 | $7,304,619 |
| Total | 662 | $24,841,164 | 671 | $27,756,136 |
- Source: Organization for Economic Co-operation and Development (OECD) Statistics.
- Source: Observatoire des sciences et des technologies (OST) for number of publications, and OECD for GERD, 2011.
- Source: Observatoire des sciences et des technologies (OST), 2012.
- Source: Observatoire des sciences et des technologies (OST), 2012.
- Source: Observatoire des sciences et des technologies (OST), 2012.
- Source: OECD (2011), "Researchers", in OECD, OECD Factbook 2011-2012: Economic, Environmental and Social Statistics, OECD Publishing.
- Source: CIHR Administrative Database, 2012.
- Source: CIHR Administrative Database, 2012.
- Source: CIHR Research Reporting System (RRS) Database, 2012.
- Source: CIHR Administrative Database, 2012.
- Source: Organization for Economic Co-operation and Development (OECD) Statistics.
- Source: CIHR Administrative Database, 2012.
- Source: CIHR Administrative Database, 2012.
- Source: CIHR Administrative Database, 2012.
- Source: CIHR Administrative Database, 2012.
- Source: CIHR Administrative Database, 2012.
- Date modified: